Forecast Issued: June 10, 2025
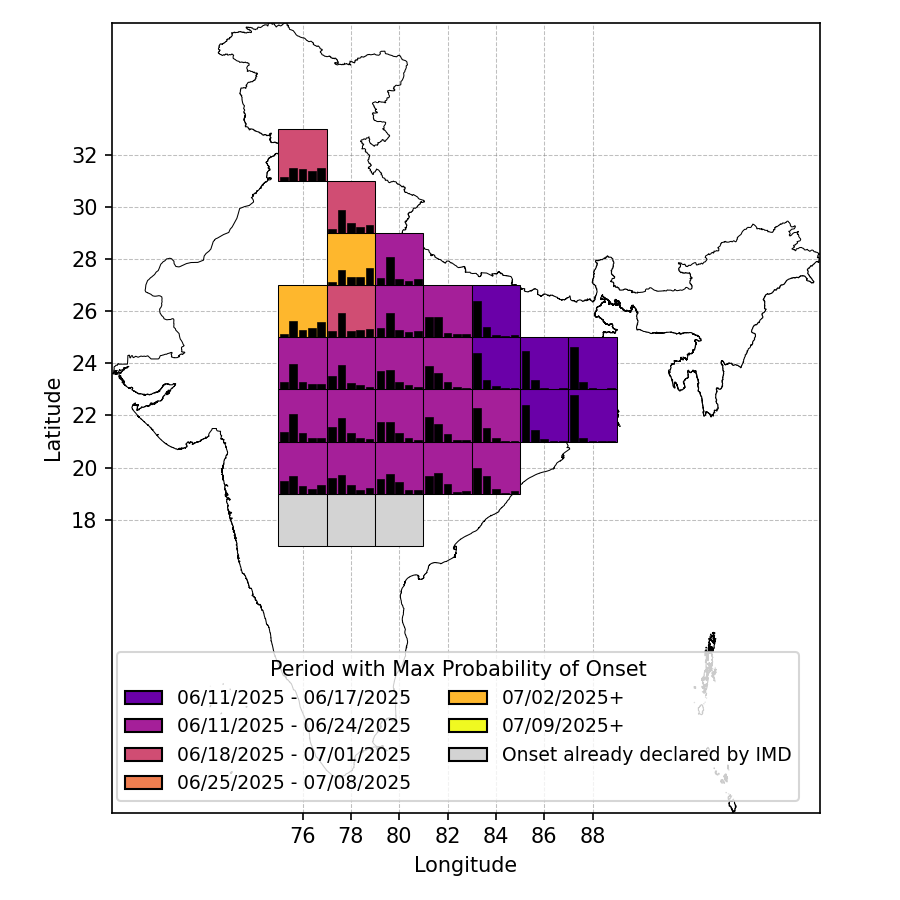
The five bars inside each 2° x 2° box correspond to the blended model's probability of onset occurring within the next 1, 2, 3, 4 weeks or later, respectively. Boxes are color-coded to mark the two consecutive weeks with the highest combined probability (see the legend). For this purpose, the "later" category is counted as a single week, and either the first week or "later" may be highlighted on their own if their individual probability exceeds 65%. For details of the forecasts, see the technical overview below.
The blended model's forecast probabilities and messages are archived on Zenodo: ![]()
Forecast Issued: June 3, 2025
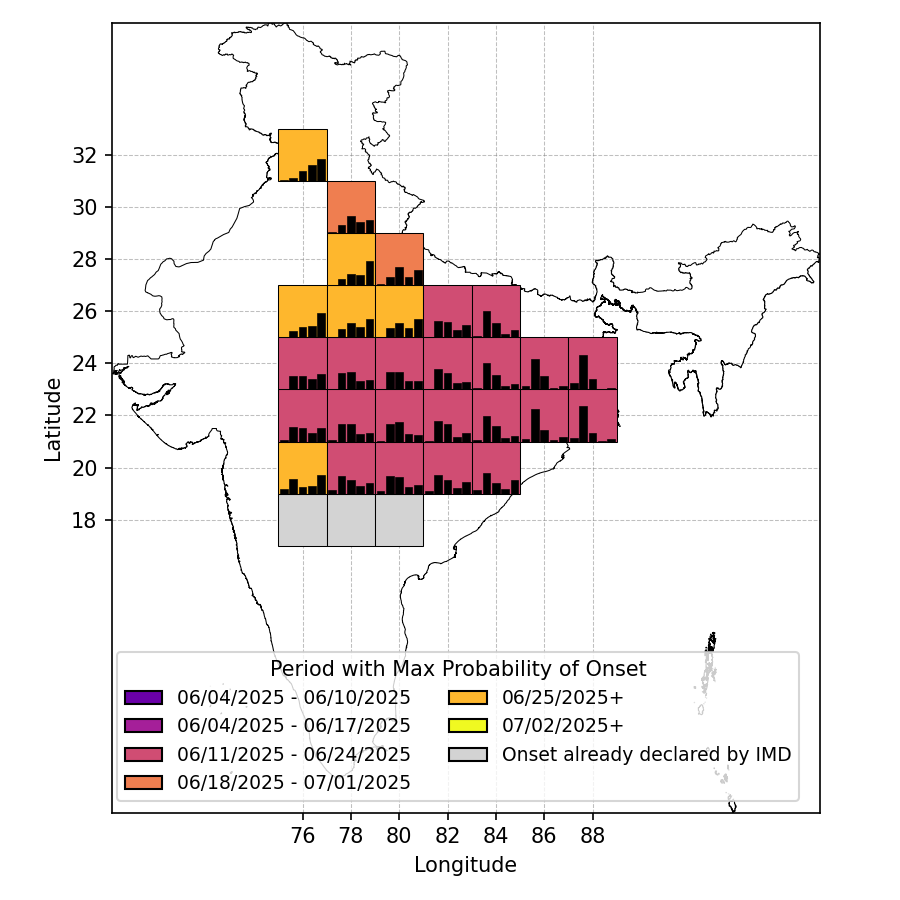
The five bars inside each 2° x 2° box correspond to the blended model's probability of onset occurring within the next 1, 2, 3, 4 weeks or later, respectively. Boxes are color-coded to mark the two consecutive weeks with the highest combined probability (see the legend). For this purpose, the "later" category is counted as a single week, and either the first week or "later" may be highlighted on their own if their individual probability exceeds 65%. For details of the forecasts, see the technical overview on the previous page.
The blended model's forecast probabilities and messages are archived on Zenodo: ![]()
Forecast Issued: May 27, 2025
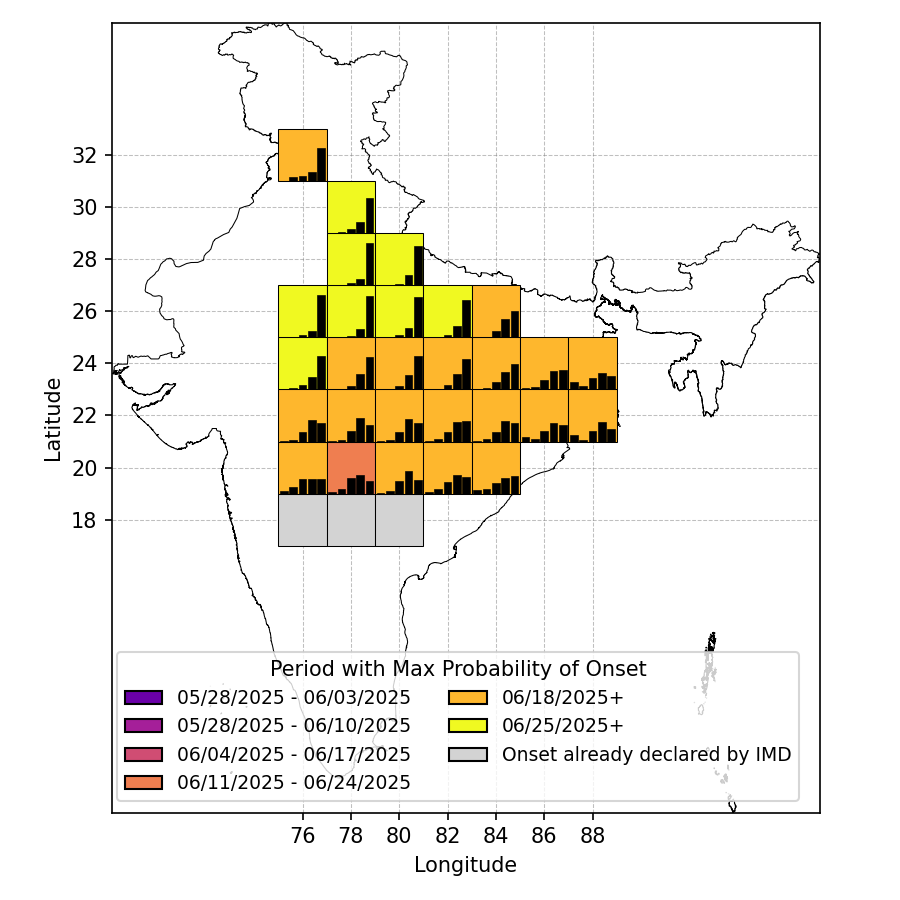
The five bars inside each 2° x 2° box correspond to the blended model's probability of onset occurring within the next 1, 2, 3, 4 weeks or later, respectively. Boxes are color-coded to mark the two consecutive weeks with the highest combined probability (see the legend). For this purpose, the "later" category is counted as a single week, and either the first week or "later" may be highlighted on their own if their individual probability exceeds 65%. For details of the forecasts, see the technical overview on the previous page.
The blended model's forecast probabilities and messages are archived on Zenodo: ![]()
Forecast Issued: May 20, 2025
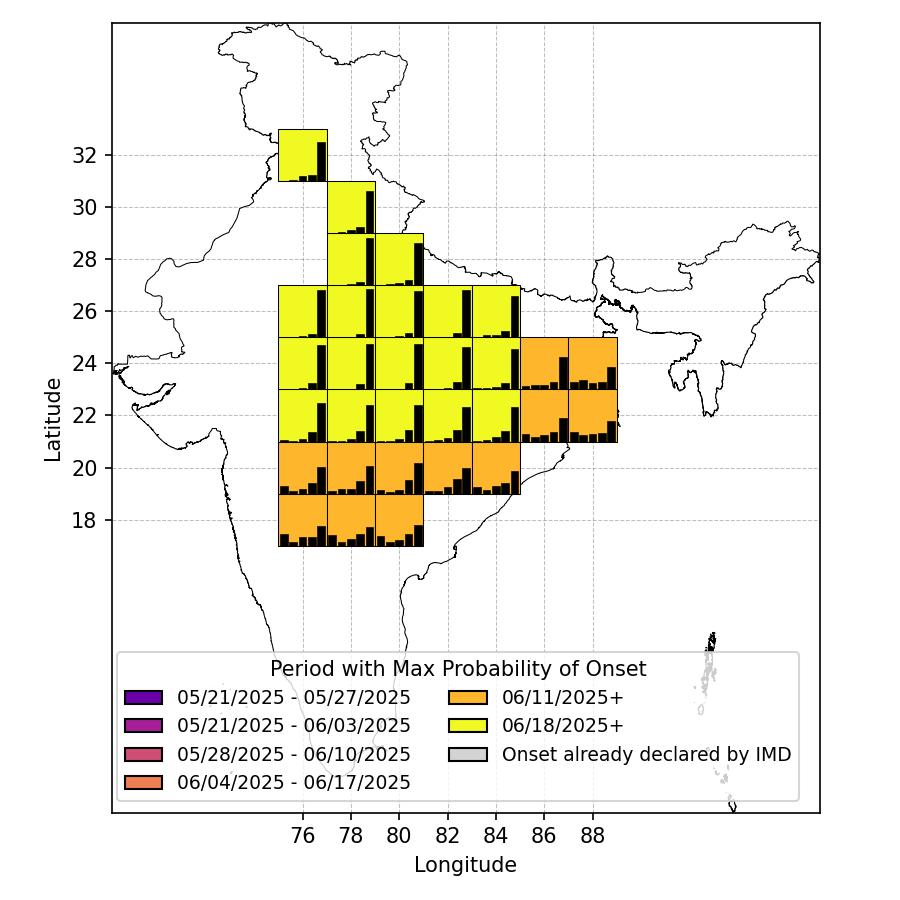
The five bars inside each 2° x 2° box correspond to the blended model's probability of onset occurring within the next 1, 2, 3, 4 weeks or later, respectively. Boxes are color-coded to mark the two consecutive weeks with the highest combined probability (see the legend). For this purpose, the "later" category is counted as a single week, and either the first week or "later" may be highlighted on their own if their individual probability exceeds 65%. For details of the forecasts, see the technical overview on the previous page.
The blended model's forecast probabilities and messages are archived on Zenodo: ![]()