Technical Overview of Forecast Generation and Benchmark
To know more about the team curating the forecasts, click here.
The onset of the Indian monsoon is a widespread seasonal phenomenon bringing consistent heavy rainfall that is critically important to Indian agriculture. Predicting when the monsoon rains will start in a particular location can be hugely beneficial to decision-making, especially when farmers are given enough lead-time to make consequential decisions around planted area, crop choice, and other major non-marginal management decisions. Forecast skill at daily to multi-week time scales has been transformed in the last few decades, and more recently, by significant advances in the development of process-based models and the introduction of artificial intelligence (AI) to weather forecasting.
This operational system provides forecasts of the local start of monsoon rains across India using a blend of two open-source AI-based models and over a century of historical rainfall statistics, benchmarked (i.e., objectively validated) against both a conventional reference and state-of-the-art numerical weather prediction (NWP) forecasts. The AI models used in this system were selected by evaluating a larger set of publicly available AI-based models that were capable of being transparently benchmarked and deployed operationally, and which also included rainfall forecasts in their output.
This operational system employs the Moron-Robertson definition of the local start of monsoon rains (MR index; Moron and Robertson, 2014) applied after the onset of the monsoon in Kerala because of the role that nationally declared onset date plays in farmers' planting decisions, according to fieldwork. Probabilistic forecasts are generated on 2×2° grid boxes for the probability of local rainy season onset one to four weeks after the day a forecast is generated. To learn more about the procedure used to benchmark the models and generate the forecast, please refer to the documentation below.
Definition of Rainy Season Onset
An agriculturally focused index that estimates the date of the start of local monsoon rains for every year at 2° spatial resolution (2° ≃ 200 km at the equator) is used. First, whether the India Meteorological Department (IMD) has declared monsoon onset over Kerala (the first stage of the large-scale onset over most of the Indian subcontinent) is identified, and then the MR index is calculated in each grid box. This index was chosen because it links onset to a minimum rainfall threshold sufficient for seed germination and filters out "false starts", thus addressing crop-sowing requirements and significantly reducing the risk of crop failure due to premature planting (Burlig et al., 2024).
The MR index defines local rainy season onset as the first wet day (≥1 mm of rain) of the first 5-day wet sequence that accumulates at least the amount of the local climatological April-October 5-day wet spell, provided it is not followed by any 10-day dry spell (with ≤5 mm of total rainfall) within the subsequent 30 days. Monsoon Onset over Kerala (MOK) is filtered for before the MR index criterion is applied to screen out onsets that occur before the first nationally-announced date of monsoon onset that occurs over mainland India. MOK is widely disseminated by IMD and known by farmers.
Table 1. Criteria for Classification as Agriculturally Relevant Monsoon Onset within a 2° x 2° Grid Box
| Criterion |
Description |
| Kerala Occurrence |
IMD has declared monsoon onset in Kerala¹ |
| Daily Rainfall Threshold |
At least 1 mm of rainfall observed on the date of onset |
| 5-Day Rainfall Accumulation Threshold |
The 5-day period starting on the day of onset must exhibit at least the climatological average amount of rain for a 5-day period between April and October for that grid box.² |
| No Dry Spell within 30 Days |
No 10-day period in the next thirty days receives less than 5 mm of rain |
Forecast Generation and Benchmarking Procedure
Forecasts were generated and evaluated through a comprehensive benchmarking process that initially selected five publicly available models, compared them over a recent period (2018-2023) and an earlier period (1965-1978), identified the better performers, and then conducted more rigorous testing on the chosen models (summarized in Figure 1 and further described below).
(1) Identify Models
AIFS
GenCast
GraphCast
FuXi
NeuralGCM
IFS S2S
(NWP Comparison)
(2) Evaluate Models -
'ground truth' is IMD gridded rain gauge data
Preliminary Evaluation
Metrics: MAE, FAR, MR
Baseline: Climatology
Period: 2018-2023
Initial Screen
AIFS
NeuralGCM
Secondary Evaluation
Metrics: MAE, FAR, MR, AUC (probabilistic)
Baseline: Climatology
Period: 1965-1978, 2018-2023
Chosen Models
AIFS
NeuralGCM
(3) Blend Models, Synthesize Output and Disseminate Forecasts
Blend AIFS, NeuralGCM
ML technique with IMD rain data (1901-2024)
Forecast Output
Max probabilities over 1- and 2-week periods
Review Forecasts
Consider relevant synoptic features, observed rainfall, consult other models twice per week
Disseminate Forecasts
Distill into clear, field-tested messages (in Hindi, Punjabi, Marathi, Odia, and Bangla), sent to farmers via SMS
Figure 1. Summary of forecast evaluation, generation, review, and dissemination procedure.
Models Compared
The outputs of multiple publicly available AI forecasting models were compared. These were selected because they can be transparently benchmarked (i.e., all required data are available or can be produced), forecast rainfall, and can be used operationally for dissemination (Table 2).
Table 2. AI-based Models Compared for Potential Use in Agriculturally Relevant Onset Forecasts
| Model Name (Source) |
Forecast Type |
Spatiotemporal Resolution |
Max Lead |
Training; Tuning Periods |
Eval. Period |
| AIFS (ECMWF, Lang et al. 2024) |
Deterministic |
0.25°/6-hour |
40 Days |
1979-2020; 2019-2022 |
1965-1978; 2018-2023 |
| FuXi (Fudan University, Shanghai Academy of AI for Sciences, Chen et al. 2023) |
Deterministic |
0.25°/6-hour |
20 Days |
1979-2015; 2016-2017 |
2018-2023 |
| GenCast (Google Deepmind, Price et al. 2025) |
Probabilistic |
0.25°/12-hour |
20 Days |
1979-2018 |
2018-2023 |
| GraphCast (Google Deepmind, Lam et al. 2022) |
Deterministic |
0.25°/6-hour |
20 Days |
1979-2017; 2016-2022 |
2018-2023 |
| NeuralGCM -IMERG (Google,Yuval et al. 2024) |
Probabilistic |
2.8°/6-hour |
45 Days |
2001-2018 |
1965-1978; 2018-2023 |
Forecast Model Selection Process
From the five identified AI models, forecasts were produced over periods of 1965 to 2024 that fall outside the training period of the models. Their performance was then compared against the European Centre for Medium-Range Weather Forecasts (ECMWF, 2023) IFS S2S model (a state-of-the-art physics-based model for weather forecasting with reforecasts available from 2004-2024 at 1.5° spatial resolution) and against a climatological predictor derived from IMD rain gauge data (Pai et al. 2014).
The true onset in each year is calculated by applying the MR index definition on the IMD's gridded rain-gauge data.Each model's performance was compared to the true onset in each year using Mean Absolute Error (MAE), False Alarm Rate (FAR), and Miss Rate (MR) as our three metrics for error (summarized in Table 3). These error rates were compared to a baseline of using the climatological onset date (i.e., average onset date over a historical period) as a forecast. The values are calculated for the 1965-1978 period and 2018-2024 period together. Of the five AI-based models we compared, NeuralGCM and AIFS performed the best.
Table 3. Metrics for Model Benchmarking to Choose Best AI Models for Agriculturally Relevant Onset
| Metric |
Description |
| Mean Absolute Error (MAE) - Deterministic |
Average absolute error measured in number of days between the true onset and model's prediction |
| False Alarm Rate (FAR) - Deterministic |
Number of times a monsoon onset is forecast but does not occur divided by total number of times monsoon onset is predicted |
| Miss Rate (MR) - Deterministic |
How often no monsoon onset is forecast when it does happen in reality divided by number of times onset happened within the time period regardless of whether it was forecast |
| Brier Score - Probabilistic |
For a series of binary predictions (e.g., “onset will occur during this week” or “there will be a dry spell after this rainy period”), the Brier score is the average of the square of the difference between the observed outcome (1 or 0) and the probability assigned to occurrence. A lower Brier score is better. |
| Area Under the ROC Curve (AUC) - Probabilistic |
The Receiver Operating Characteristic curve (ROC) associated with a forecast maps out how well classification rules based on picking a probability threshold (i.e. “more than 70% = likely, less than 70% = unlikely) can identify events and non-events. The area under this curve is a measure of how much information the forecasts contain. |
Forecast Generation Procedure
To generate the forecasts in real-time, the best-performing AI models from the benchmarking analysis (NeuralGCM and AIFS) were run and then blended to further improve their performance, as combining information from multiple models typically leads to more informative predictions than using any individual model. A model blending technique common in machine learning is applied to combine information from historical IMD rain gauge data (1901-2024) as well as the 40-day rainfall predictions from the NeuralGCM and AIFS models. Specifically, these model predictions are input into a multinomial logistic regression (“blending”) model predicting the probability of onset in either the first week after the forecast initialization date, the second, third, or fourth weeks, or more than four weeks. This regression uses historical data to choose weights based on how predictive each source is both individually and jointly for local rainy season onset.
For standard metrics for probabilistic forecasts (Brier Score and AUC) this model blend outperforms any individual model when predicting out-of-sample. The specific form of the blended model was chosen via a leave-one-year-out cross-validation technique designed to avoid overfitting, using 2000-2023 data.
Evaluate and Synthesize Output
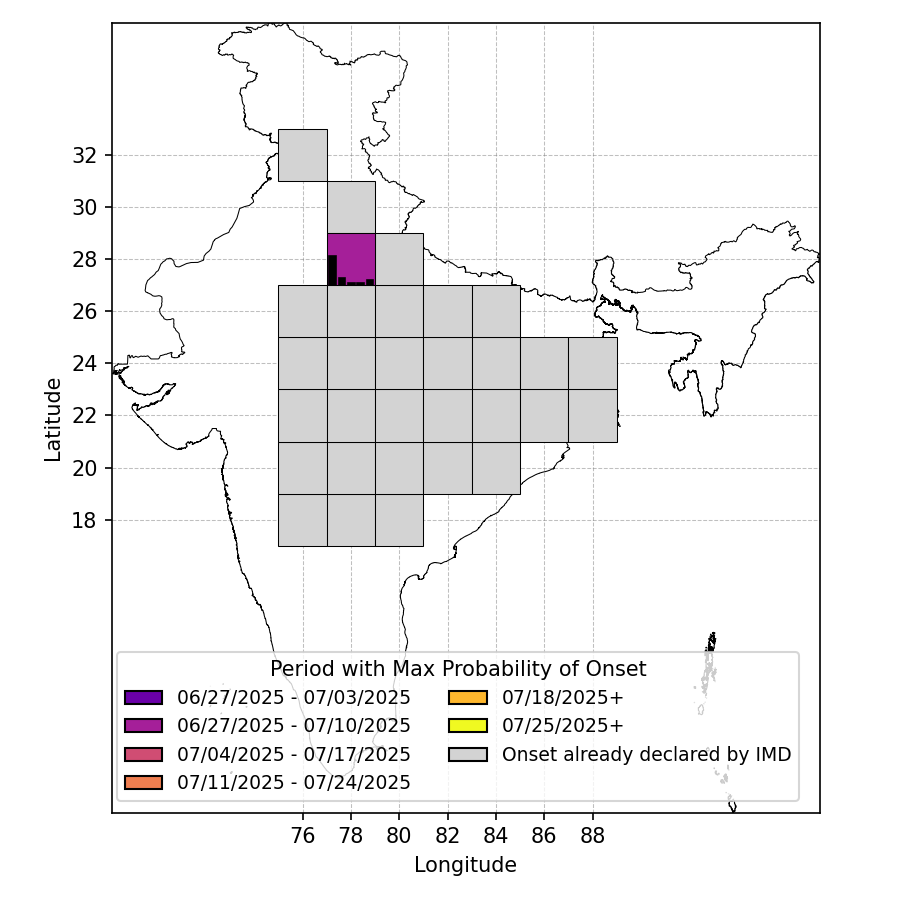
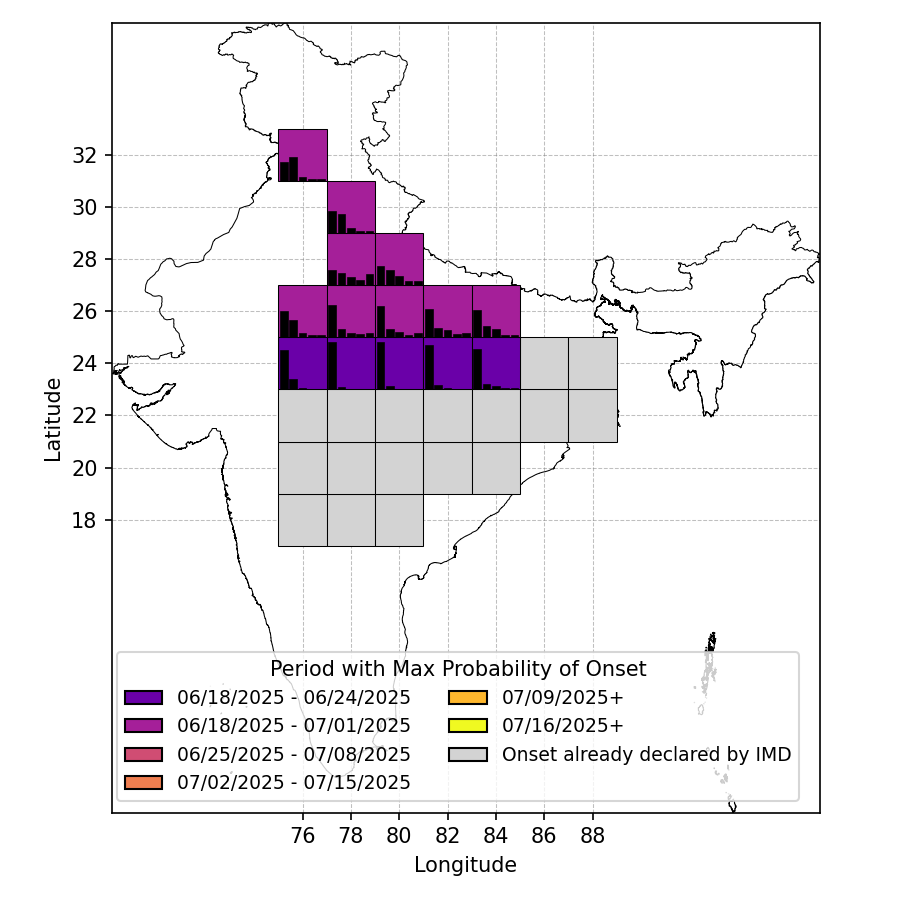
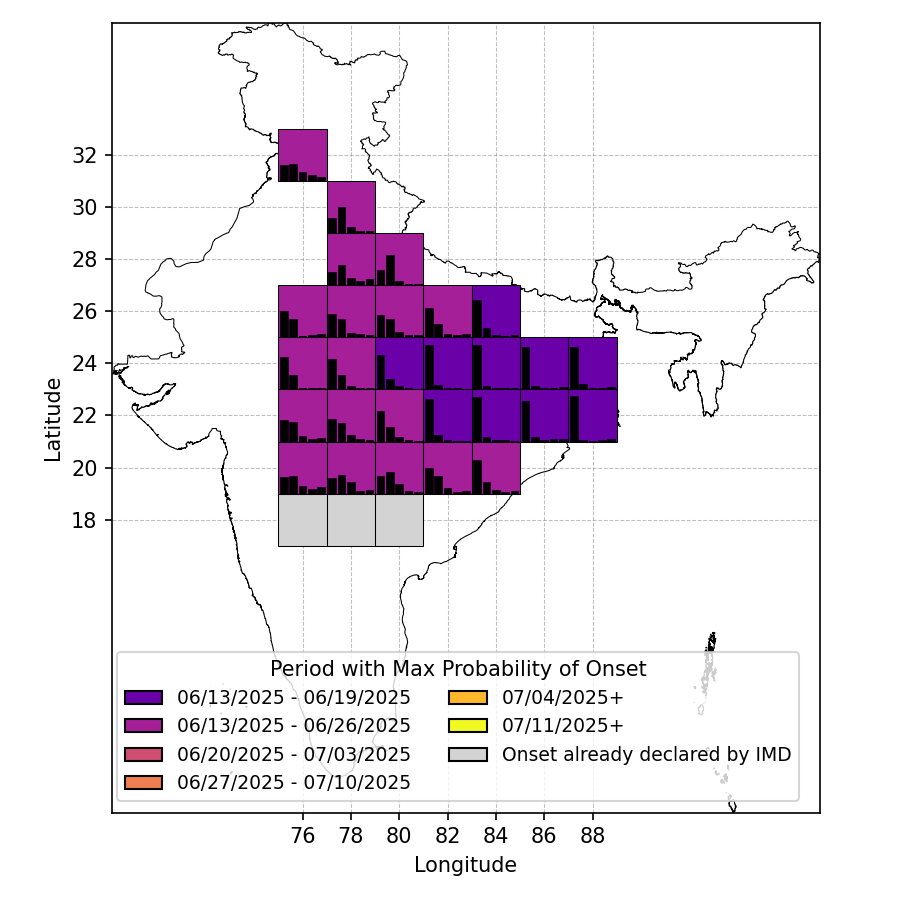
This forecast model can produce probabilities of agriculturally relevant monsoon onset occurrence several weeks in the future, outputting the likelihood of onset for 1 week, 2 weeks, 3 weeks, 4 weeks, or >4 weeks ahead. These probabilities are evaluated to identify the two-week period of maximum likelihood of occurrence. If a single week exceeds 65% chance of occurrence, the likelihood is communicated as a one-week period.
Forecast Dissemination Procedure
The AI models are run daily and systematically evaluate their outputs twice a week (Tuesdays and Thursdays) in a technical expert review meeting. In Tuesday and Thursday briefings, current synoptic features, observed rainfall, and rainfall forecasts from state-of-the-art NWP models are reviewed. These meteorological features are compared with the outputs of the blended model, the level of confidence of the model is reviewed, and diagnostics on how the final forecast compares with the raw model outputs are run. On Tuesdays, this information is distilled into clear, field-tested messages that can be sent to farmers via SMS, as well as other platforms, with updates after the Thursday evaluations if the models' forecasts have significantly changed since the Tuesday briefings.
Evaluating This Year's Forecasts
Once IMD rain gauge data is available for this year's monsoon season, forecasts will be scored on the primary probabilistic metrics (Brier Score and AUC), as well as the fraction of instances in which the period the model identified as having maximum likelihood of onset contained the true agriculturally relevant onset. These will be compared to a climatological benchmark predictor based on past IMD rain gauge data.
Acknowledgments
We are grateful to AIM for Scale for support. We thank the University of Chicago Research Computing Center and Data Science Institute for providing the high-performance computing resources that make these forecasts possible.
For helpful comments and conversations, we thank Prof. Subimal Ghosh (Indian Institute of Technology, Bombay), Prof. Raghu Murtugudde (Indian Institute of Technology, Bombay), Prof. Vincent Moron (Aix-Marseille Université), Prof. Partha Mukhopadhyay (Indian Institute of Science Education and Research, Berhampur), Dr. Genevieve Flaspohler (Rhiza Research), Prof. Peter Huybers (Harvard University), Dr. Simon Mason (International Research Institute for Climate and Society, Columbia University), Dr. Andrew Robertson (International Research Institute for Climate and Society, Columbia University), Dr. Angela Rigden (University of California, Irvine), Prof. David Battisti (University of Washington), and Prof. Lucas Vargas Zeppetello (University of California, Berkeley). Prof. Moron provided Matlab code for the onset index against which our own Python code was validated. Dr. Stephan Hoyer, Shreya Agrawal, and Dr. Janni Yuval from Google helped with initializing NeuralGCM from a real-time NWP initial condition.
References
- Burlig, Fiona and Jina, Amir and Kelley, Erin M and Lane, Gregory V and Sahai, Harshil (2024). 'Long-Range Forecasts As Climate Adaptation: Experimental Evidence From Developing-Country Agriculture.' National Bureau of Economic Research. Working Paper Series, 32173. 10.3386/w32173
- Chen, L. Zhong, X., Zhang, F., Cheng, Y., Xu, Y., Qi, Y., and Li., H.(2023). 'Fuxi: A cascade machine learning forecasting system for 15-day global weather forecast.' npj Climate and Atmospheric Science, 6(1):190.
- European Center for Medium Range Weather Forecasts (2023). 'IFS Documentation CY48R1 - Part V: Ensemble Prediction System.' 10.21957/e529074162
- Lam, R., Sanchez-Gonzalez, A. and Wilson, M., Wirnsberger, P., Fortunato, M., Alet, F., Ravuri, S., Ewalds, T. Eaton-Rosen, Z., Hu, W. and others (2022) 'Learning skillful medium-range global weather forecasting.' Science 382(6677): 1416-1421.
- Lang, S., Alexe, M., Chantry, M., Dramsch, J., Pinault, F., Raoult, B., Clare, M.C.A., Lessig, C., Maier-Gerber, M., Magnusson, L. and others. (2024). 'AIFS-ECMWF's data-driven forecasting system.' arXiv preprint arXiv:2406.01465.
- Kochkov, D., Yuval, J., Langmore, I., Norgaard, P., Smith, J., Mooers, G., Kl¨ower, M., Lottes, J., Rasp, S., D¨uben, P., and others. (2024). 'Neural general circulation models for weather and climate.' Nature, pages 1-7.
- Moron, V. and Robertson, A.W. (2014). 'Interannual variability of indian summer monsoon rainfall onset date at local scale.' International journal of climatology, 34(4).
- Pai, DS, Rajeevan, M., Sreejith, O.P., Mukhopadhyay, B., and Satbha, N.S.. (2014). 'Development of a new high spatial resolution (0.25° x 0.25°) long period (1901-2010) daily gridded rainfall data set over India and its comparison with existing data sets over the region.' Mausam, 65(1):1-18.
- Price, I., Alvaro Sanchez-Gonzalez, Ferran Alet, Tom R Andersson, Andrew El-Kadi, Dominic Masters, Timo Ewalds, Jacklynn Stott, Shakir Mohamed, Peter Battaglia, et al. 'Probabilistic weather forecasting with machine learning.' Nature, 637(8044):84-90, 2025.
- Yuval, J., Langmore, I., Kochkov, D., and Hoyer S. (2024). 'Neural general circulation models optimized to predict satellite-based precipitation observations.' arXiv:2412.11973.
¹ Monsoon Onset over Kerala is defined using the IMD Definition: if after 10th May, 60% of the available 14 weather stations in Kerala report rainfall of 2.5 mm or more for two consecutive days, the onset over Kerala is declared on the 2nd day, provided the some other criteria (e.g. Depth of westerlies should be maintained up to 600 hPa) are also in concurrence. See link for detailed information.
² Climatological average during April-October is calculated over the period from 1901 to 2023, based on observed rain-gauge data from IMD. The ground truth dataset is IMD's rain-gauge data available at 1º resolution from 1901-2024 (Pai et al. 2014), regridded to a 2º resolution using standard conservative remapping techniques.